
This type of page is the top level of the ocean color level 1 and 2 browser. This is where you specify your search criteria and launch your search for level 1 and 2 scenes.
Here are a few sample data ordering scenarios.
Click on the various parts of the sample page layout below for a description of the functions of the various components.

Top of page
![]() Select a longer time period
Select a longer time period
Click on the up arrow to switch to the next longer
time period
that encompasses the current one. For example, if the current
time period is a single day, then this button will take you to
the eight-day period (octave) that includes that day. From there
the up arrow would take you to the month that includes all or part
of the eight-day period. From there the up arrow takes you to
the encompassing year, and from there the up arrow takes you to
the time period representing the entire mission. The up arrow
is disabled if the current time period is "Mission" or
a customized range of dates.
Top of page
![]() Select previous time period
Select previous time period
Click on the left arrow to go to the previous (i.e. earlier) time
period of the same length as the current one. For example, if the
current time period is August of 2003, then the left arrow will take
you to July 2003. Similarly, if the current time period is 12 February
2004, then this button will take you to 11 February 2004.
The left arrow is disabled if the current time period is
"Mission" or
a customized range of dates.
It is also disabled when the current period is the earliest one
that contains data from the
selected sensors.
Top of page
![]() Select next time period
Select next time period
Click on the right arrow to go to the next (i.e. more recent) time
period of the same length as the current one. For example, if the
current time period is the 8-day period beginning on 26 February
2004, then this button will take you to the 8-day period beginning
on 5 March 2004. Similarly, if the current time period is the year,
2003, then this button will take you to the year, 2004.
The right arrow is disabled if the current time period is
"Mission" or
a customized range of dates.
It is also disabled when the current period is the most recent one
that contains data from the
selected sensors.
Top of page
![]() Switch to true color images
Switch to true color images
Clicking the "TC" button tells the web interface
to display quasi-True-Color both for the
global map and for the
sets of thumbnail images
that result from a search. This change to
quasi-true-color will remain in effect for subsequent pages
until changed again by the Chl, SST, or SST4 buttons. This button
is inactive if true color is already being displayed or if
none of the currently selected
suite of sensors include
a true color product or if only nighttime
scenes are selected.
Top of page
![]() Switch to chlorophyll images
Switch to chlorophyll images
Clicking the "Chl" button tells the web interface
to display pseudocolor chlorophyll both for the
global map and for the
sets of thumbnail images
that result from a search. This change to
chlorophyll images will remain in effect for subsequent pages
until changed again by the TC, SST, or SST4 buttons. This button is
inactive if chlorophyll images are already being displayed or if
only nighttime scenes are selected.
Top of page
![]() Switch to 11 μm sea surface temperature images
(MODIS only)
Switch to 11 μm sea surface temperature images
(MODIS only)
Clicking the "SST" button tells the web interface
to display pseudocolor sea surface temperatures
derived from MODIS
11 and 12 μm bands both for the
global map and for the
sets of thumbnail images
that result from a search. This
change to SST images will remain in effect for subsequent
pages until changed again by the TC, Chl, or SST4 buttons. This
button is inactive if SST images are already being displayed
or if none of the currently selected suite of sensors
include an SST product. Note that SST images for SeaWiFS
are not possible because that sensor was not designed to
measure temperature.
Top of page
![]() Switch to 4 μm sea surface temperature images
(MODIS only, nighttime only)
Switch to 4 μm sea surface temperature images
(MODIS only, nighttime only)
Clicking the "SST4" button tells the web interface
to display pseudocolor sea surface temperatures
derived from MODIS 4 μm bands
both for the
global map and for the
sets of thumbnail images
that result from a search. This
change to SST4 images will remain in effect for subsequent
pages until changed again by the TC, Chl, or SST buttons. This
button is inactive if SST4 images are already being displayed
or if none of the currently selected suite of sensors
include an SST4 product or if only daytime data have been selected
(the 4 μm bands are rendered unreliable by daylight).
Note that SST images for SeaWiFS
are not possible because that sensor was not designed to
measure temperature.
Note that your choice of SST or SST4 or Chl or TC has no effect on the number of scenes returned by a search. These are just different ways of visualizing the data contained within the scenes you are searching for.
Top of page
![]()
![]() Access to SeaWiFS data
Access to SeaWiFS data
SeaWiFS data which are less than five years old have
certain restrictions on their distribution. Although
the entire SeaWiFS archive is viewable by
anyone in the form of browse images, only
authorized
SeaWiFS users may obtain the higher-resolution
level-1 and level-2 data from which the browse images
were made. This button provides access to those data
to authorized users who have been given a username and
password on our system. (Note that this password
is different from the one provided by the Goddard
DAAC.) Once a valid username/password has been
given, the browser will function exactly as before
with the exception that
SeaWiFS GAC and MLAC files in
our archive that are less than five years old will
be downloadable via individual
hyperlinks and the bulk
ordering process. If you are an authorized
user who has forgotten (or not yet been issued)
your username/password on our system, you may
request a new one.
Top of page
![]() Colorbars
Colorbars
The color-scale button fetches the legend that relates
color in the chlorophyll images to chlorophyll concentration
and the legend that relates color in the SST images to sea
surface temperature.
Top of page
![]() Leave Comments / Ask Questions
Leave Comments / Ask Questions
This button will drop you into the
Satellite
Data Access
section of the Ocean Color Forum where you may make any
comments or suggestions about the ocean color browser or
ask a question about something that is unclear to you.
The members of the
Ocean
Color staff routinely read these postings and
respond as appropriate.
Top of page
![]() Help
Help
This button takes you to the page you are currently reading.
Top of page
 Select Sensors and Data Types
Use these checkboxes to choose which sensors (currently
SeaWiFS Aqua-MODIS, Terra-MODIS, OCTS, and CZCS)
and/or SeaWiFS data types (GAC and MLAC) you wish
to include in your search for scenes.
Not selecting any of these is the same as selecting them all.
Note that as of 14 September 2009 there is no longer
a checkbox for SeaWiFS LAC data. All onboard recorded
LAC files can be obtained as a part of the corresponding
MLAC (merged-LAC) file.
Two types of SeaWiFS data are accessible via this browser: GAC and MLAC.
GAC (Global Area Coverage) data are subsampled and recorded onboard the spacecraft and subsequently downloaded twice a day at NASA/Goddard and have an effective resolution of about 4.5 kilometers along the center of the swath. LAC (Local Area Coverage) data are recorded at full 1.1 kilometer resolution for selected parts of the world and downloaded with the GAC data. HRPT (High Resolution Picture Transmission) data have the same basic format and resolution as the LAC data, but they are collected by ground stations within range of the OrbView-2 spacecraft transmitter.
All SeaWiFS 1-km-resolution data which have been collected by various HRPT stations, as well as the LAC data recorded onboard the spacecraft, have been consolidated into Level-1A files on a per orbit basis. These merged LAC (MLAC) files contain all available SeaWiFS HRPT and LAC data for a given orbit. In geographic regions with a high concentration of HRPT stations, the data collected from multiple stations will frequently overlap. Any duplicate scans resulting from that overlap are evaluated through a series of quality tests, and only the "best quality" scan is stored in the MLAC file. The quality tests look at pixel-to-pixel variance between duplicate scans, and bit-error counts derived from sync words and other places within the frame where bit patterns can be known a priori.
This process significantly reduces the transmission noise inherent in HRPT data stream, and elimination of duplicate observations makes it possible to bin the MLAC data with the same algorthms and software used for SeaWiFS GAC or MODIS. Level-1A or Level-2 MLAC data is identical in format to SeaWiFS LAC and HRPT, except that the scan times may be discontinuous due to gaps in the HRPT/LAC geographic coverage.
Top of page
 Select Daytime or Nighttime or Both
(Only SST is available at night and only from MODIS)
Select Daytime or Nighttime or Both
(Only SST is available at night and only from MODIS)
Use these checkboxes to constrain your search to daytime (and mixed) only
or nighttime (and mixed) only scenes, or check both boxes
to remove this constraint. (If both boxes are left unchecked,
then searches default to day/mixed scenes only. Mixed scenes are
those that span the terminator and therefore contain both daytime
and nighttime pixels.)
Note that the map shifts its center longitude to 180 when only the Night box is checked and the Reconfigure page button is clicked. This is because the nighttime data day used by this interface was chosen to better match the UTC day during which most of the scenes in each global daily map were collected. This is in contrast to the nighttime data day used for our archived level-3 nighttime products. Those maps are centered on the prime meridian like the daytime products, but the scenes included in each daily map are collected between roughly mid-day UTC of the previous day and mid-day of the nominal day.
Top of page
 Search radius
This control only has an effect for single-point
locations i.e. locations specified by a click on
the map or by a
single latitude/longitude pair typed
in and submitted via the Find
swaths button. With
this control you can specify a geographical area of
interest that includes all of the Earth's surface
within the given radius in kilometers of your selected
location. The nominal minimum radius (which is also the
default if you do not select a radius) is 72 kilometers
because the search function is implemented in terms of
equal area bins
that are roughly 144 kilometers wide.
Top of page
 AOI Fraction
Use these radio buttons to specify how much of
your area of interest any selected swath must
include. This control may be gainfully used to
select swaths that are centered (across track) on a
particular location. For instance, choose "all" of
the area of interest in conjunction with a radius of
1500 kilometers to select only MLAC (or longer LAC)
swaths that are centered (in the across track sense)
on your map click or entered latitude/longitude
pair. (To select centered SeaWiFS GAC swaths you must
reduce the radius to 800 kilometers since GAC swaths
are only 1500 kilometers wide. 800 kilometers works
even though twice 800 is greater than the SeaWiFS
GAC swath width because of the 72-kilometer
bin size that has been mentioned before. These radii
were chosen based on SeaWiFS swath characteristics,
and since I my experience with MODIS data is limited,
I am leaving them as they are for now.)
Top of page
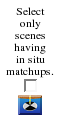 In Situ Matchups
If you check the box over the little secchi disc icon,
then your searches will be further restricted
to include only scenes for which we have corresponding in situ data.
These data will be displayed on the resultant
individual scene pages
which will be modified to look something like the example below.

Red push pins will mark the locations of the in situ data records on the
browse images, and a table of the in situ data will appear in the lower
right portion of the page.
The in situ data displayed by this browser are from the SeaBASS validation data set, that is, the near-surface radiometric and pigment data used to generate SeaWiFS, MODIS-Aqua, and other ocean color satellite "matchups". The original source data (e.g., radiometric and pigment depth profiles) used to generate these values are publicly available via all SeaBASS search engines, and may be located using the metadata provided by the Browser. The data provided by the Browser are also publicly available, for research and educational use only, following the NASA Earth Science Data and Information Policy. For details regarding in situ data processing and satellite validation, please refer to Werdell and Bailey 2005 and Bailey and Werdell 2006.
Please note that these data are sparsely distributed both spatially and temporally. If you are searching over a small region or a short time span and have checked the in situ matchups box, then the odds are pretty high that your search will not find any scenes. Needless to say, there will be no in situ matchups for the most recently received satellite data.
Top of page
![]() Thumbnails per Page
Thumbnails per Page
Some searches can find thousands of swaths. In order
to avoid straining the resources of the computer
running your web browser, this control limits the
number of thumbnails that will be displayed at one
time on a single web page. This number can also be
adjusted from the
Thumbnails page.
Top of page
![]() Date Range
Date Range
Immediately above the global image is a text string
that indicates which time period will be used for
data searches. It also indicates the time period of
the global image itself. This text string is also a
hyperlink. If you would like to search for data over
a time range that is not represented by any of the
calendar choices below the global image, then follow
this hyperlink and follow the instructions on the
resulting page.
When you return, the text string will display the
custom date range if possible, and subsequent searches
will only return scenes for the ranges of days you
specified. (Since we generate the global images ahead
of time for each predefined time period, such images
will not be available for user defined time periods,
and the corresponding mission-long composite will be
displayed instead.)
Top of page
![]() Global Map
Global Map
The global images presented represent the average of
all of the swaths of a given sensor
and type (SeaWiFS GAC or MLAC,
or MODIS [Terra or Aqua], OCTS, or CZCS) collected during the indicated time
period. For chlorophyll, the average is computed
after leaving out land, cloud, or otherwise masked
pixels. The same is true for sea surface temperature
images (MODIS only). For the true-color composites, all pixels -- cloudy or
not -- are included in the average with the result
that areas which have greater cloud cover over time
(such as the intertropical convergence zone) appear
more white in the composites. If you have specified
a customized date
range, then a cumulative, mission-length composite
is displayed for the data types and sensors you selected.
You can launch searches for scenes by clicking on the part of the world that you are interested in. The latitude and longitude of your click along with the time period indicated above the map and any other settings from the controls to the left and right of the map (except for the coordinate entry fields which are overridden by a map click) are used to select the scenes in your area of interest.
Top of page
![]() Parameter Label
Parameter Label
This annotation below the global map indicates which parameter
the global map and scene thumbnails represent. You can change
the parameter by clicking the TC,
SST, SST4, or
Chl buttons.
The number of scenes found by a search is independent of which
parameter is currently being displayed.
Top of page
 Select Predefined Areas of Interest
This scrollable list of predefined geographical
regions provides you with a more intuitive way of
selecting your area of interest. (I generated
these somewhat haphazardly when I needed a mindless
break from other work. If you need other areas, let me
know and I may add them as time allows.)
If you return to the top level page via the
up arrow after performing
other searches, then any predefined regions that
you had selected for the previous search will still
be selected and will be displayed at the top of the
list. Otherwise, the predefined regions are presented
in alphabetical order.
Top of page
 Coordinate entry fields
Enter either a point location consisting of a single
latitude (entered in either the "N:"
or the "S:" box) and a single
longitude (entered in either the "W:"
or the ":E" box), or specify
an area by entering the northern and southern
bounding latitudes and the western and eastern
bounding longitudes in the appropriate spaces. All
latitudes and longitudes should be entered in decimal
degrees. Longitudes west of the prime meridian and
latitudes south of the equator should be entered as
negative values.
Top of page
![]() Start Your Search
Start Your Search
One way to begin a search is to click on the
global map, but that method passes
along the coordinates of your click. To start a search without
that additional information, click on this button.
Clicking on this button without specifying any geographical
constraints at all will return all available scenes for the
whole world for the current time period.
Top of page
![]() Reconfigure Image and Links
Reconfigure Image and Links
If you click this button after changing any
of the aforementioned settings, then you will
get the same type of page back except that all
of its links will now incorporate the changes
you made to the controls. In particular, the
central map image
will display data (where available) of the types checked off to
the left of the map (i.e. GAC, MLAC,
MODIS(Aqua), MODIS(Terra), OCTS, CZCS or some combination of these). Again,
if none of the sensors/types are checked, then all
will be displayed. When multiple data types are
displayed together, they are overlaid on each other
as follows. SeaWiFS MLAC composites are placed on top
of GAC composites
which in turn overlay MODIS-Aqua composites, etc.
If the paramater currently selected is not available
from all of the selected sensors (e.g. SST is not
available from SeaWiFS), then the composite map will
formed by overlaying only the sensors that do have
the selected parameter.
Top of page
![]() Search the entire mission
Search the entire mission
This hyperlink sets the date range
to encompass all of the data that we have available for the
selected sensors. If the page is already configured for this
most inclusive date range, then the vertically spelled out
"Mission" will not be a hyperlink.
Top of page
![]() Choose a particular year in which to search for data
Choose a particular year in which to search for data
These hyperlinks let you choose a particular year before
you begin your search for data. If the current
date range is already a calendar
year, then that particular year is not presented as a hyperlink
in this table.
Top of page
 Choose a particular month in which to search for data
Each row in this table represents a specific year,
and each column represents a month of the year. The months are in
chronological order from left to right, and each is represented by
the first three letters of its English name. Click on one of these letters
to choose that particular month for searching. Months that fall
outside of the mission
date range are not given as hyperlinks.
If the current date range represents
a calendar month, then that month's first letter is also not a
hyperlink. Each month that is included -- in whole or in part -- in
the current date range will have a yellow background in this table
as an additional visual clue of the period you are searching over.
Top of page
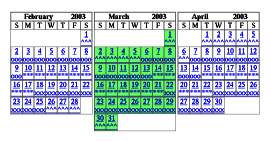 Calendars
Click on any of the ninety or so dates in these three calendars
to choose a single day to search over. Click on any of the
character triplets below the dates to set the page to display
the corresponding eight-day period. (The characters used here
have no particular significance other than to help visually
group the days in each eight-day period and to distinguish
adjacent eight-day periods from each other.)
The default time period initially displayed is for the entire mission, and the three calendars initially displayed are for the three most recent months for which we have data. If you select a new month from the table at the left, then that month will become the middle of the three calendars displayed at the right (except in the case of the earliest and latest months for which we have data in which case the selected month will be the first or last, respectively, of the three calendars). If you select a new year from the table on the left, then, if possible, the calendars on the right will remain at the same months but in the newly selected year. If you select Mission from the table on the left, the calendars on the right will not change.
If the current date range is a single day or one of the canonical eight-day periods, then the corresponding placeholders in the calendars will not be hyperlinks. Dates for which we have no scenes at all for the selected sensors will also not be presented as hyperlinks. Dates in the three calendars that are part of the current date range have a green background. Remember, however, that the current date range can extend beyond the three months displayed by the three calendars.
This information was last updated on 14 September 2009 by Norman Kuring.