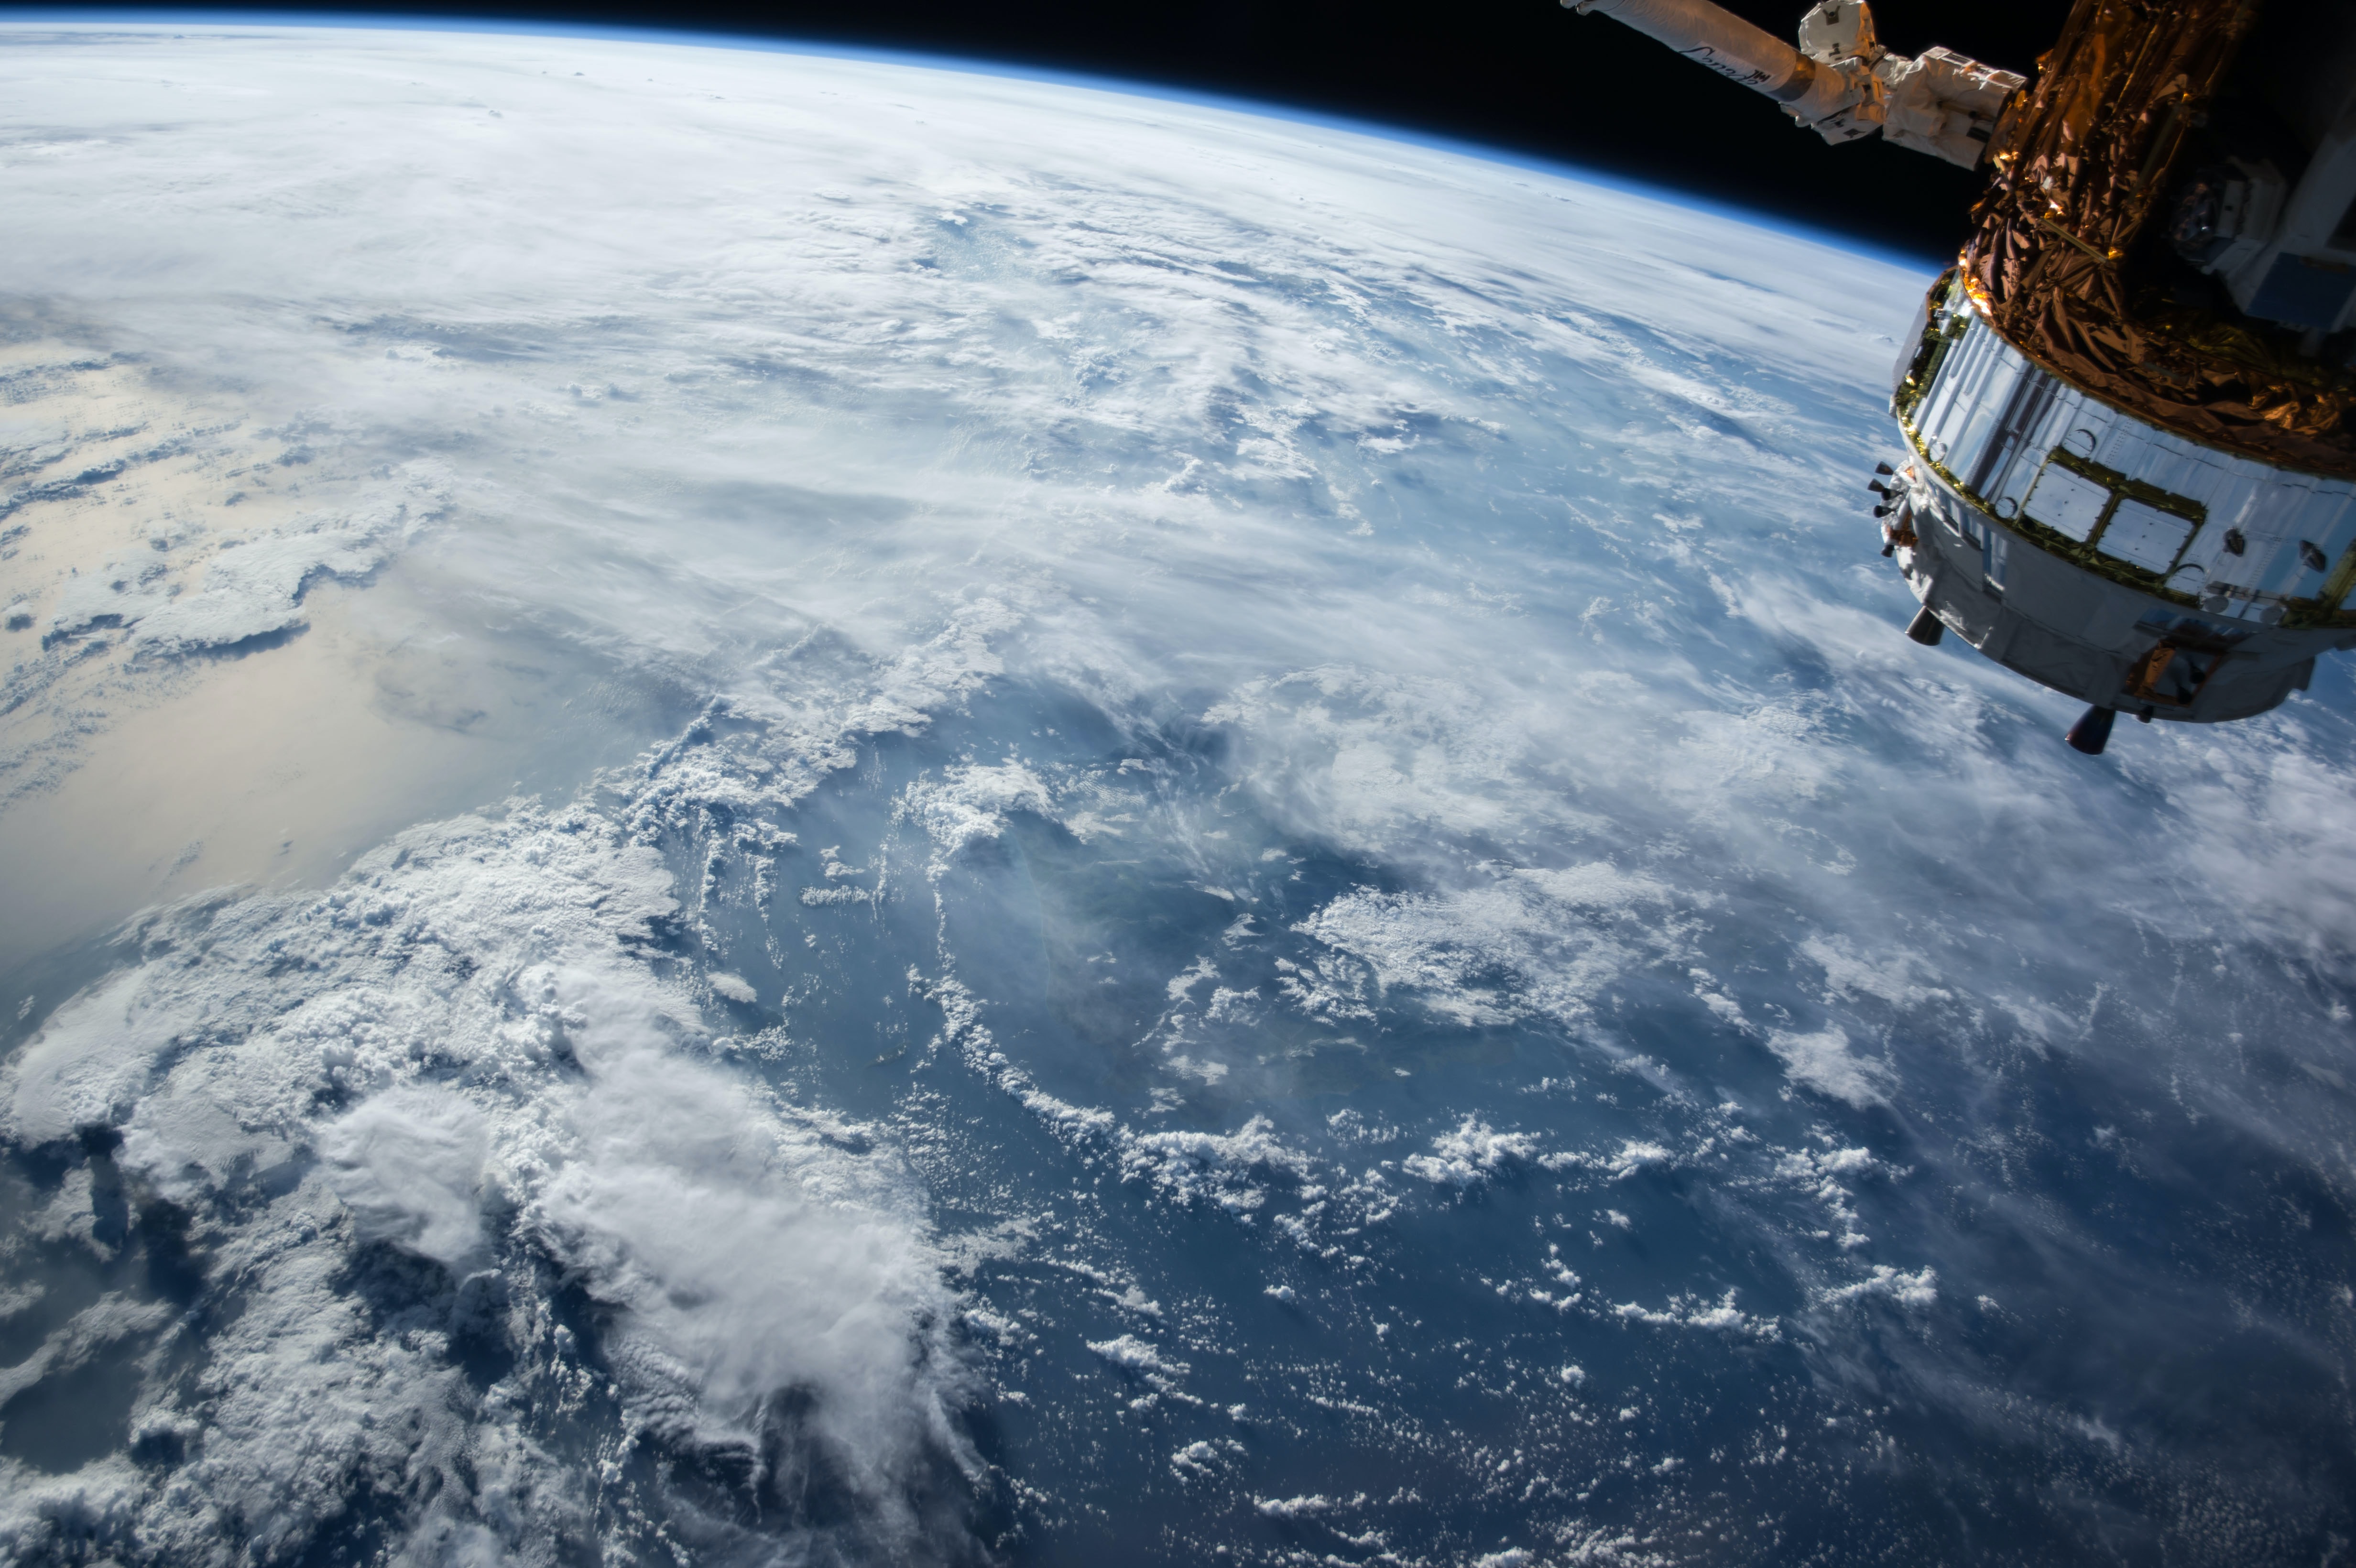
NASA deploys a number of Earth observing instruments that measure the spectral nature, or color, of water. Specifically, NASA acquires, archives, and publicly distributes such data from a variety of sources, including remote sensing ocean color instruments on satellite and airborne platforms, as well as similar measurements made on shipborne field campaigns, by long-duration autonomous in situ platforms, and derived as Earth system model outputs.
The Ocean Biology Processing Group (OBPG) at NASA's Goddard Space Flight Center has been operating and supporting the Ocean Color Web since 1996. As a Science Investigator-led Processing System (SIPS), our responsibilities include the collection, processing, calibration, validation of ocean-related products from a large number of operational, satellite-based remote-sensing missions providing ocean color, sea surface temperature and sea surface salinity data to the international research community. As a Distributed Active Archive Center (DAAC), known as the Ocean Biology DAAC (OB.DAAC), we are responsible for the archive and distribution of satellite ocean biology data produced or collected under NASA EOSDIS, including those from historical missions and partner space organizations.
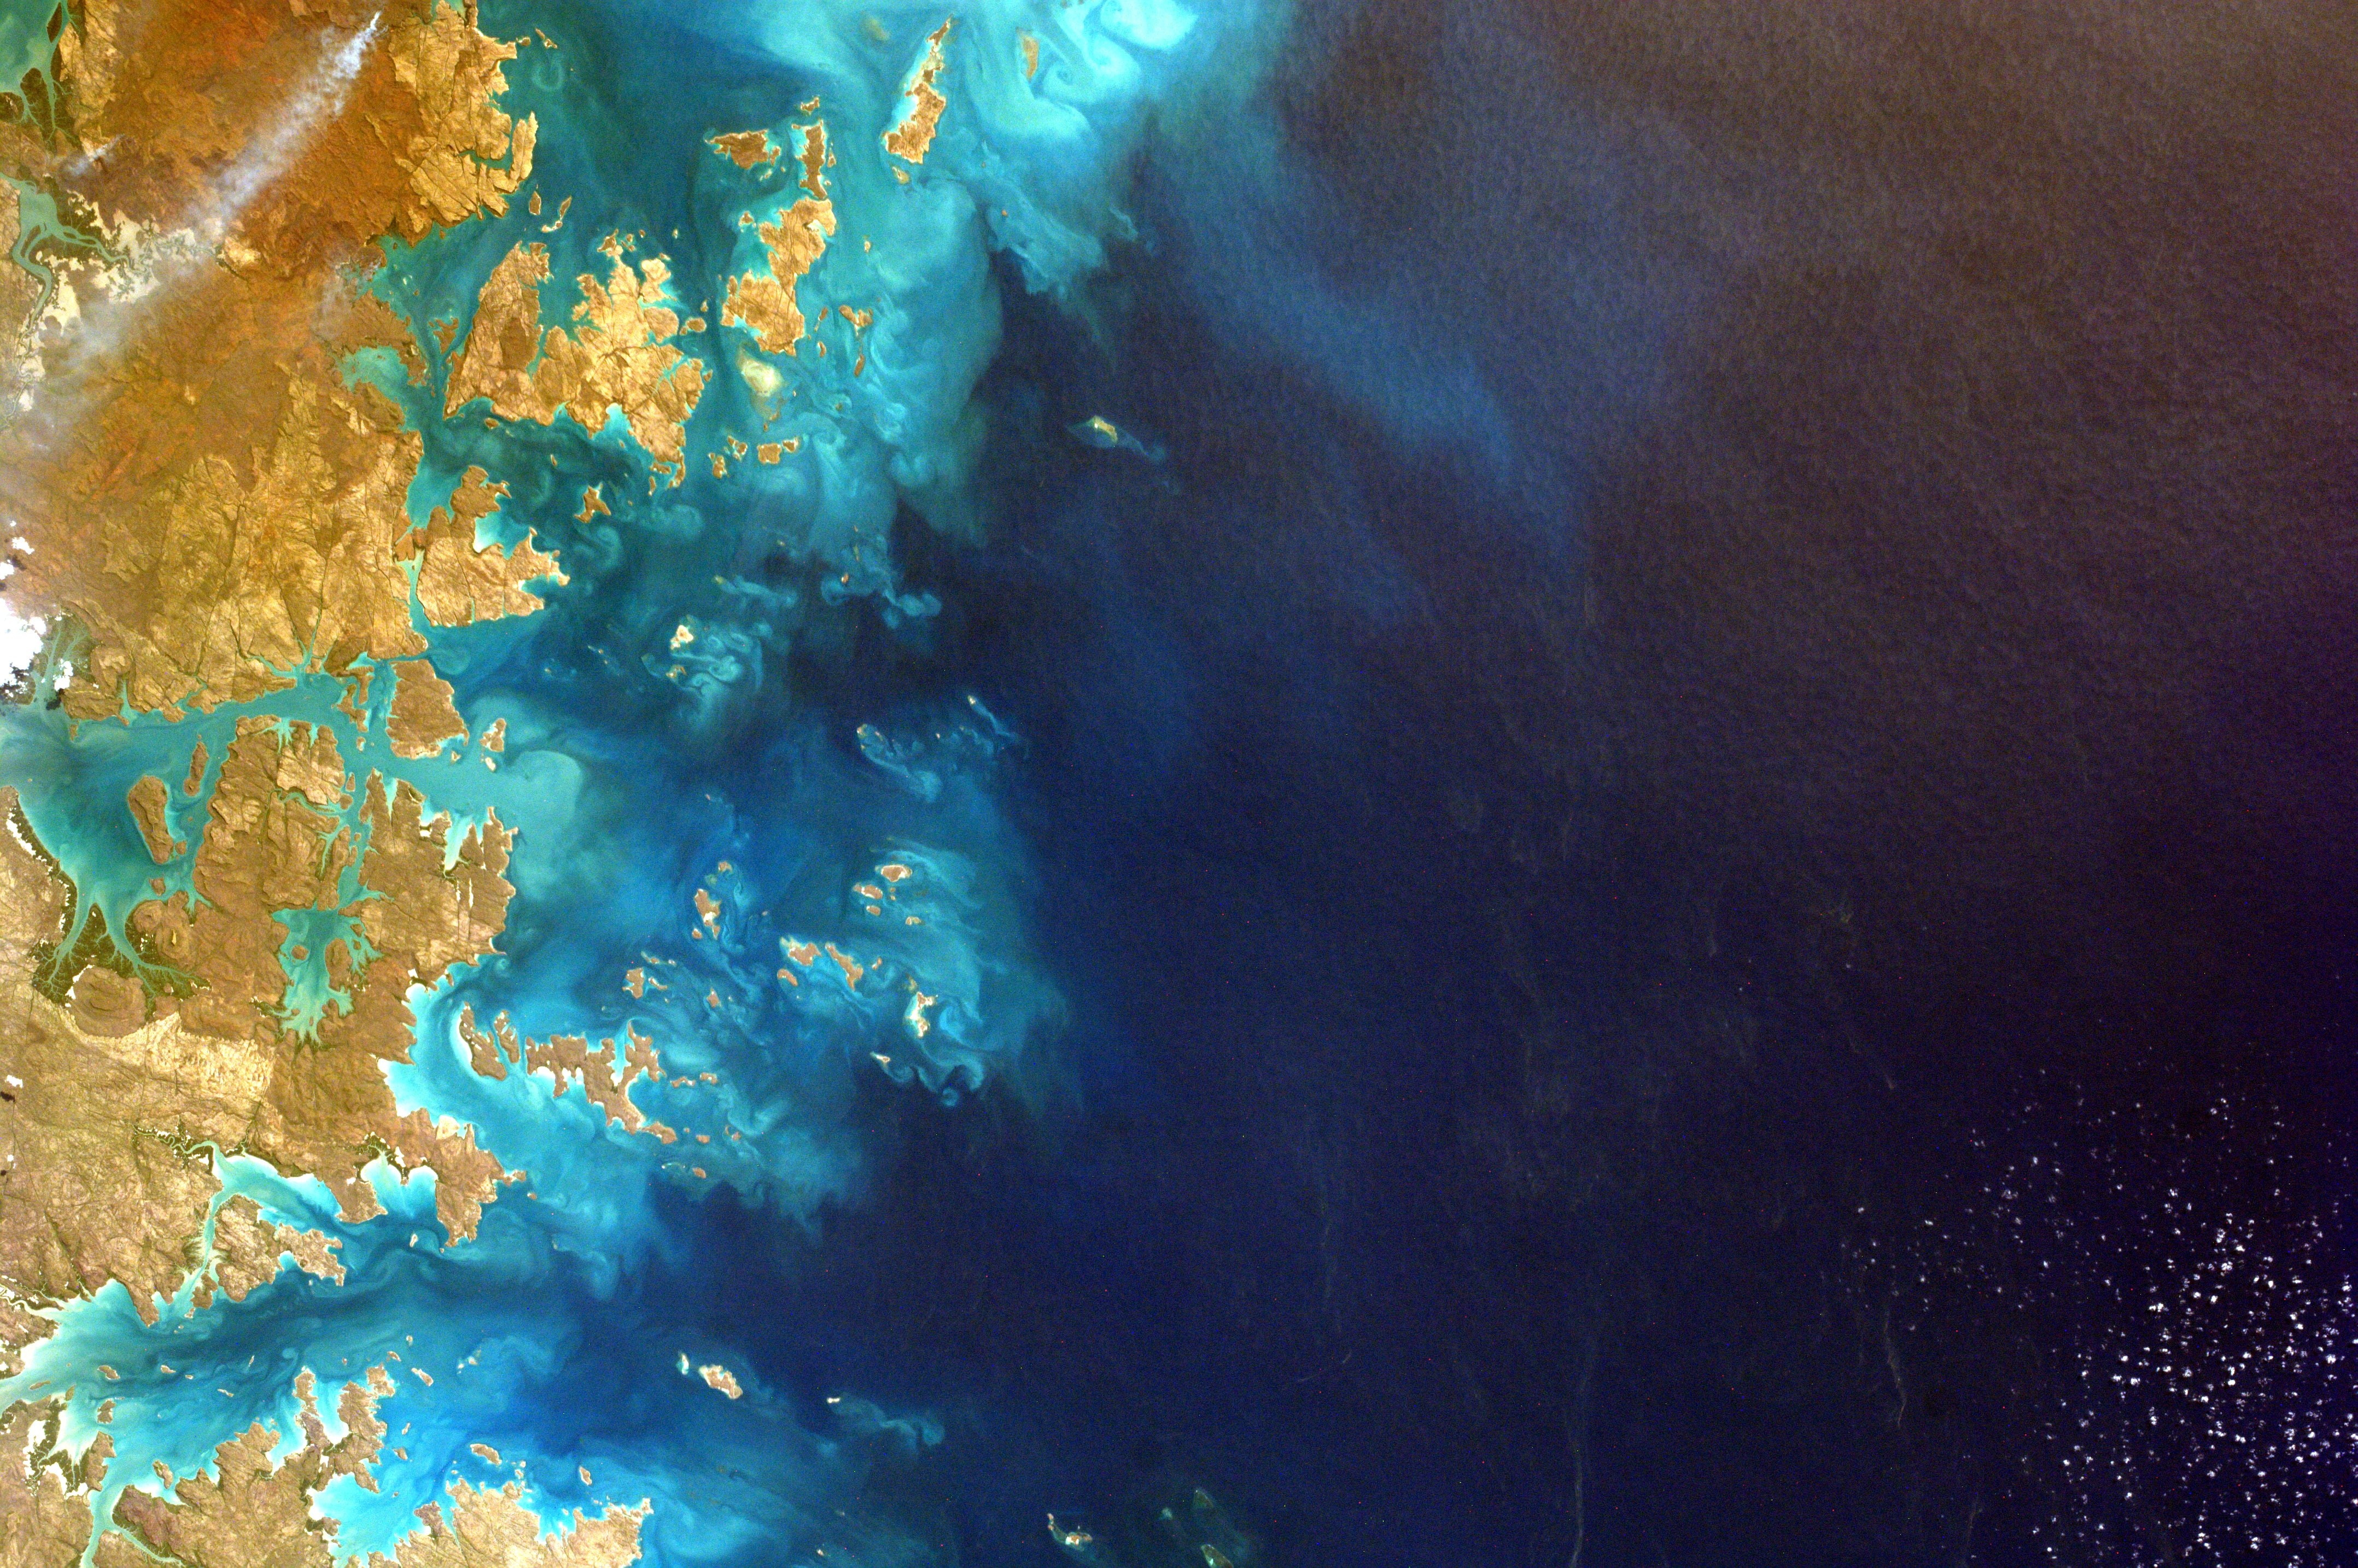
Ocean Color is the apparent hue, shade, or tone of water that results from the interactions of sunlight with the microscopic composition of the water column and water itself. Typical relevant water constituents include phytoplankton, mineral particles, and dissolved organic matter. The color of the ocean varies with how these materials in seawater absorb and scatter photons of different wavelengths, which varies with their composition. For example, highly productive waters where phytoplankton are abundant can appear green, whereas less productive waters with fewer constituents typically appear blue.
The spectral nature of color of the water, that is, the intensity at which different wavelengths absorb and scatter photons, can be used to infer the quality and quantity of materials that comprise natural waters - allowing scientists, policymakers, and society as a whole to understand their composition on local to global scales. This understanding can lend insight into how aquatic organisms at the base of the food chain thrive or decline under changing conditions of their environments.
[ 13 Mar 2025 ] SeaDAS Export Image Tutorial: Create Publication Quality Scene Images Watch this video for stp-by-step instructions on how to export publication quality scene images for SeaDAS.
[ 10 Feb 2025 ] SeaDAS Processors Tutorial: Watch this video for stp-by-step instructions on installing and updating OCSSW processors for SeaDAS.
[ 04 Feb 2025 ] PACE OCI V3 reprocessing: The PACE OCI V3 reprocessing is now underway, and OCI V2 processing has been halted. Click for more details.
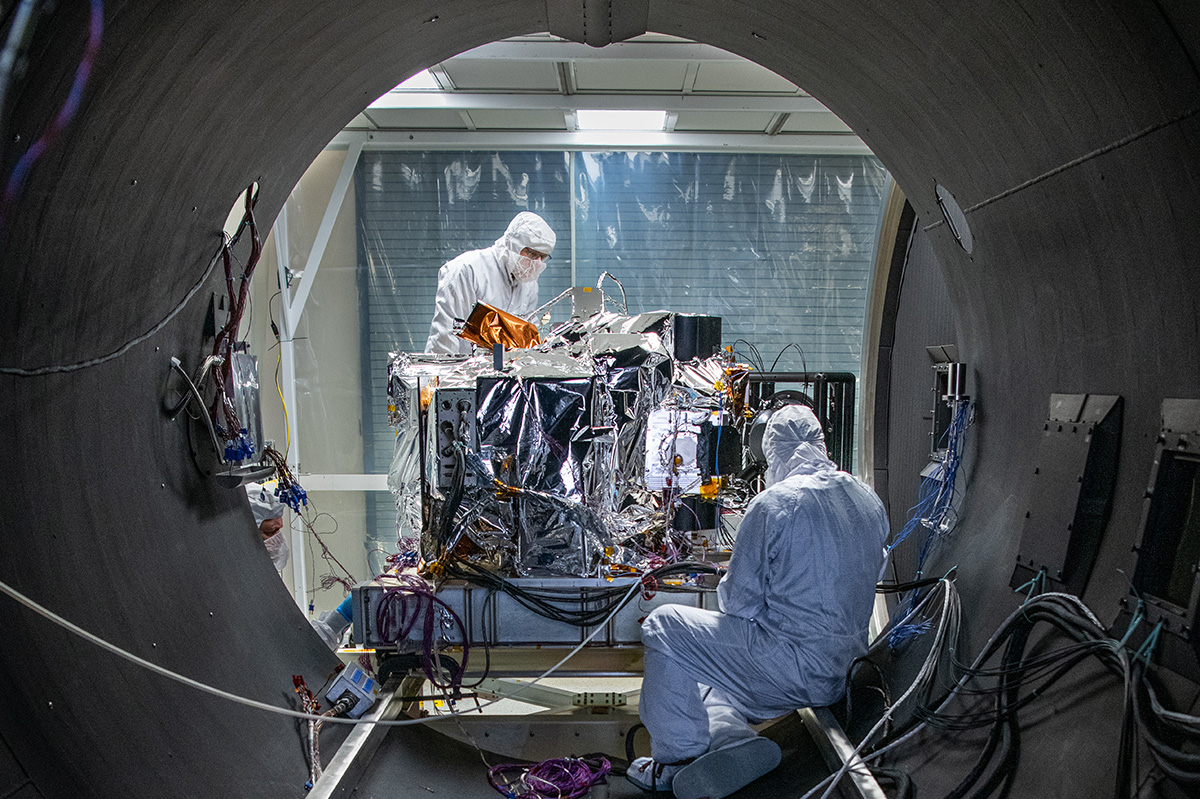
PACE will extend and improve upon NASA's 20+ years of global satellite observations of our living ocean, atmospheric aerosols, and clouds and initiate an advanced set of climate-relevant data records. By determining the distribution of phytoplankton, PACE will help assess ocean health. It will also continue key measurements related to air quality and climate. PACE's specific science goals include: extending systematic ocean color, atmospheric aerosol, and cloud data records for Earth system and climate studies; and addressing new and emerging science questions by detecting a broader range of color wavelengths that will provide new and unprecedented detail.
PACE will be the first mission to provide measurements that enable prediction of the “boom-bust” cycle of fisheries, the appearance of harmful algae, and other factors that affect commercial and recreational industries. PACE will observe clouds and tiny airborne particles that absorb and reflect sunlight, known as aerosols. Many stakeholders rely on these key data to forecast weather, visibility and air quality. And, PACE will observe the ocean, clouds, and aerosols together to better understand their interactions. Ultimately, PACE will provide observations that benefit society in ways that current satellites cannot.