The Ocean Biology Processing Group (OBPG) completed a full-mission ocean color reprocessing of the MODIS-Aqua (MODISA) ocean color dataset in June 2015. This reprocessing is part of a multi-mission effort to update common algorithms, product suites, and data formats across all supported missions. Sensor-independent changes are detailed in the R2014.0 Ocean Color Reprocessing General Description. Here we describe the MODISA sensor-specific details of the reprocessing, and provide an assessment of data quality and impact relative to the previous MODISA reprocessing version R2013.1 .
As in previous reprocessings, R2014.0 starts from the MODISA Level-1A files. The Level-1A source files are unchanged for this reprocessing.
The calibration approach for R2014.0 is unchanged from R2013.1: for all bands, the gains are derived from solar diffuser measurements for each detector and mirror side. For most bands, lunar calibration measurements are used to derive a temporally varying scan angle adjustment (or 'response-versus-scan', RVS). For bands 13-16 (which saturate many pixels when viewing the moon), only the unsaturated pixels are used (using a ratio technique developed by MCST). For bands 8 and 9 (412nm and 443nm), the temporal trend for several scan angles (even for the solar diffuser scan angle) is derived using the trending from desert sites. The values derived with the above methods are provided to the OBPG by MCST in the form of special LUTs ending with the suffix 'OC2'. The version used for R2014.0 is V6.1.33.8_OC2.
Using these special LUTs as a starting point, the OBPG derives additional corrections. First, a detector correction is derived for the NIR bands (748nm and 869nm), using a method described in (Meister et al. 2009) that flat-fields the top-of-atmosphere (TOA) radiances for the detectors relative to each other after taking into account the expected variations due to atmospheric scattering. (The NIR bands cannot be modified with the current crosscalibration approach described below, therefore they require a special analysis.)
Corrections for the remaining bands are then derived using the crosscalibration (xcal) approach described in (Meister & Franz 2014). For one day of every month, a 7 day L3 file is produced centered on the day of interest. The actual day of interest is excluded from the L3 file (note that this is a new feature in R2014.0 to avoid biasing the corrections towards a value of 1.0). The L3 file is calculated without using any data from within 300 pixels of the scan edges. The xcal coefficients M11 correct for detector and mirror side striping, as well as for scan angle dependencies. There is also a potential impact on the temporal trending, but this effect is typically small because erroneous temporal trends are usually contained in the L3 input files. However, erroneous temporal trends that mainly impact the scan edges can be corrected (because the scan edges are excluded from the L3 files) with this approach.
The xcal coefficients M11 (version axc38d) are shown as a function of time for several scan angles here, where solid and dashed lines correspond to mirror sides 1 and 2, and the detectors are color coded. The xcal coefficients are shown as a function of scan angle in the plots below (black = mission average, blue = start of mission, red = end of mission) for 4 wavelengths (mirror side 1, detector 1):

These plots show that for the blue bands, large corrections are needed for the end of scan at the end of the mission. For example, the M11 lower the 443nm radiances at the end of scan ('frame' or 'pixel' 1350 in the plots above) by about 4% in 2015. The corrections applied for the longer wavelengths are comparatively much smaller, especially regarding their temporal variation.
A comparison of global temporal anomalies of ocean products for R2014.0 (plots labeled AT126) and for R2013.1 (plots labeled AT113) shows:
Although some striping can be seen at the end of the mission, it is clearly reduced in R2014.0 relative to R2013.1, as shown in these sample images.
The OBPG applies an additional vicarious calibration to VIIRS during Level-2 processing (Franz et al. 2007). The 869nm band is assumed to be correctly calibrated from prelaunch measurements. The 748nm band is adjusted using match-ups from the South Pacific Gyre to force the aerosol type retrievals to agree, on average, with the aerosol type observed at the Tahiti AERONET site. The calibration of the visible bands (412nm to 678nm) is then adjusted to produce retrievals that match, on average, measurements from the Marine Optical Buoy (MOBy) near Lanai Hawaii. The vicarious calibration gains derived in this manner are:
| Wavelength (nm) | 412 | 443 | 469 | 488 | 531 | 547 | 555 | 645 | 667 | 678 | 748 | 859 | 869 | 1240 | 1640 | 2130 |
|---|---|---|---|---|---|---|---|---|---|---|---|---|---|---|---|---|
| Gain | 0.9722 | 0.9872 | 1.0139 | 0.9923 | 0.9995 | 0.9989 | 1.0014 | 1.0253 | 0.9996 | 1.0000 | 0.9997 | 1.0184 | 1.0 | 1.0 | 1.0 | 1.0 |
The algorithms employed and products produced from MODIS are as described in the R2014.0 Ocean Color Reprocessing General Description. Sensor-specific center wavelength values used in processing and product naming are as shown in the table above.
To assess the impact of this R2014.0 reprocessing relative to the previous R2013.1 reprocessing, a comparative timeseries analysis was performed (see (Franz 2009) for details on the evaluation approach). The impact of all calibration, algorithm, and ancillary data changes on remote sensing reflectance is shown in this comparison of 4-day mean ocean color products sampled on monthly time-scale for various globally-distributed geographic subsets. The most significant impact of the calibration changes described above are in the blue bands (412nm and 443nm) in 2014, where water-leaving radiances of R2014.0 have increased by about 10% relative to R2013.1, and in the red bands, where a significant mission trend was removed from the 667 and 678-nm time-series. The plot below shows the global deep water (> 1000m) Rrs averages as a function of time (dashed line is R2014.0, solid line is R2013.1):


Impact on the chlorophyll time-series from this reprocessing is to introduce a shift of ~0.015 mg/m^3, primarily due to the new OCI chlorophyll algorithm. The calibration changes also modify the trends in chlorophyll, as illustrated below by the deep-water temporal anomaly (relative to annual cycle) before and after the 2014.0 reprocessing.


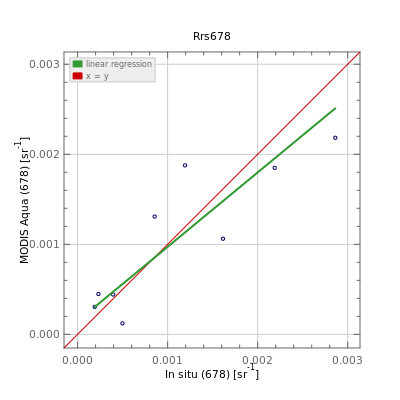
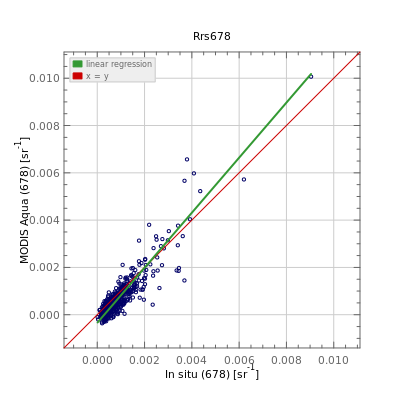
Validation of the remote sensing reflectance retrievals was performed relative to all available match-ups from SeaBASS holdings and additional match-up analysis with level 2 data from the Aerosol Robotic Network - Ocean Color (AERONET-OC). Statistical analysis of the satellite to in situ match-ups as of this writing is provided below. Also shown are scatter plots and frequency distribution comparisons.
| Product Name | MODIS Aqua Range | In situ Range | # | Best Fit Slope | Best Fit Intercept | R2 | Median Ratio | Abs % Difference | RMSE |
|---|---|---|---|---|---|---|---|---|---|
| Rrs412 | -0.00203, 0.01835 | 0.00064, 0.01964 | 295 | 0.99660 | -0.00087 | 0.77069 | 0.87986 | 22.25224 | 0.00219 |
| Rrs443 | -0.00091, 0.01464 | 0.00078, 0.01783 | 447 | 0.97806 | -0.00009 | 0.78365 | 0.99339 | 14.55635 | 0.00146 |
| Rrs488 | 0.00014, 0.01777 | 0.00126, 0.02289 | 462 | 0.88569 | 0.00007 | 0.77906 | 0.93956 | 11.25906 | 0.00135 |
| Rrs531 | 0.00084, 0.01692 | 0.00128, 0.02587 | 100 | 0.82764 | 0.00030 | 0.80363 | 0.95549 | 11.15395 | 0.00207 |
| Rrs547 | 0.00104, 0.01604 | 0.00137, 0.02759 | 53 | 0.78978 | 0.00055 | 0.73902 | 0.93792 | 12.22308 | 0.00290 |
| Rrs667 | -0.00038, 0.01182 | 0.00002, 0.01196 | 341 | 0.77995 | 0.00002 | 0.76906 | 0.96775 | 33.93695 | 0.00053 |
| Rrs678 | 0.00017, 0.00220 | 0.00019, 0.00286 | 9 | 0.81738 | 0.00017 | 0.79491 | 1.24159 | 53.66099 | 0.00044 |


| Product Name | MODIS Aqua Range | In situ Range | # | Best Fit Slope | Best Fit Intercept | R2 | Median Ratio | Abs % Difference | RMSE |
|---|---|---|---|---|---|---|---|---|---|
| Rrs412 | -0.00424, 0.01543 | 0.00001, 0.01505 | 1898 | 1.05821 | -0.00082 | 0.71558 | 0.77939 | 35.52605 | 0.00152 |
| Rrs443 | -0.00141, 0.01977 | 0.00007, 0.01620 | 1907 | 1.03652 | -0.00038 | 0.84363 | 0.91908 | 20.25085 | 0.00108 |
| Rrs488 | -0.00021, 0.02013 | 0.00039, 0.02161 | 1529 | 0.89623 | -0.00027 | 0.91819 | 0.83095 | 18.74802 | 0.00126 |
| Rrs531 | 0.00103, 0.02069 | 0.00129, 0.02285 | 683 | 0.91473 | -0.00031 | 0.90907 | 0.85525 | 16.85795 | 0.00134 |
| Rrs547 | 0.00102, 0.02623 | 0.00117, 0.02353 | 1907 | 0.92599 | -0.00020 | 0.90868 | 0.88473 | 13.67974 | 0.00120 |
| Rrs667 | -0.00033, 0.01005 | 0.00001, 0.00872 | 1453 | 1.05722 | -0.00026 | 0.83179 | 0.76657 | 28.83965 | 0.00048 |
| Rrs678 | -0.00036, 0.01007 | 0.00001, 0.00904 | 456 | 1.16416 | -0.00035 | 0.84017 | 0.75681 | 31.94963 | 0.00046 |


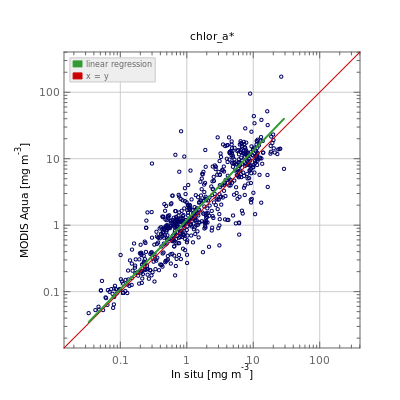
Validation of the chlorophyll retrievals was performed relative to all available match-ups in SeaBASS.
| Product Name | MODIS Aqua Range | In situ Range | # | Best Fit Slope* | Best Fit Intercept* | R2* | Median Ratio | Abs % Difference | RMSE* |
|---|---|---|---|---|---|---|---|---|---|
| chlor_a | 0.02936, 180.87000 | 0.03340, 29.00400 | 657 | 1.06702 | 0.05561 | 0.81616 | 1.15493 | 40.84688 | 0.32391 |

The reprocessing covered the period from day 160 of 2014 to day 243 of 2016 (roughly the most recent two years). Changes to the global trends are within a few percent for Rrs and chlorophyll, as shown in the deep-water trend comparisons below.


Eplee, R. E., Turpie, K. R., Meister, G., Patt, F. S., Fireman, G. F., Franz, B. A., & McClain, C. R. (2013). A synthesis of VIIRS solar and lunar calibrations. Earth Observing Systems XVIII. doi: 10.1117/12.2024069
Franz, B. A., Bailey, S. W., Werdell, P. J., & McClain, C. R. (2007). Sensor-independent approach to the vicarious calibration of satellite ocean color radiometry. Appl. Opt., 46(22), 5068. doi: 10.1364/ao.46.005068
Franz, B. A. (2009). Methods for assessing the quality and consistency of ocean color products. NASA Goddard Space Flight Center, Ocean Biology Processing Group. https://oceancolor.gsfc.nasa.gov/docs/methods/sensor_analysis_methods
Meister, G., Franz, B. A., Kwiatkowska, E. J., Eplee, R. E., & McClain, C. R. (2009, August). Detector dependency of MODIS polarization sensitivity derived from on-orbit characterization. In SPIE Optical Engineering+ Applications (pp. 74520N-74520N). International Society for Optics and Photonics. doi: 10.1117/12.825385
Meister, G., & Franz, B. A. (2014). Corrections to the MODIS Aqua Calibration Derived From MODIS Aqua Ocean Color Products. IEEE Transactions on Geoscience and Remote Sensing, 52(10), 6534-6541. doi: 10.1109/tgrs.2013.2297233
