The OBPG has evaluated the impact of reprocessing changes through global and regional time-series analyses and match-ups to in situ data. These tests are generally performed on each incremental change to verify that the results are consistent with expectation, but only the total change is presented here. For further explaination on the validation analyses presented below, please see the documentation on validation analysis methods.
The match-up analysis between SeaWiFS Level-2 retrievals and in situ observations from the SeaBASS archive generally show improved agreement in both global and coastal waters. The table below shows mean ratios and median absolute percent differences for chlorophyll and water-leaving radiances at all visible wavelengths, for SeaWiFS Reprocessing 5.2 (R2007) and this latest reprocessing (R2009). Aerosol optical thickness retrievals (not shown) improved significantly relative to ground-based microtops measurements, with mean ratios reduced from 1.4 to 0.9 and median absolute deviations reduced from 43 to 29% in global match-ups. The aerosol improvements are also evident in regional analyses, where aerosol Angstrom exponents in Chesapeake Bay are now in agreement with AERONET measurements. In addition, the Chesapeake Bay analyses highlight the substantially improved agreement relative to in situ chlorophyll measurements for turbid or highly productive waters.
| Chlorophyll | Lwn 412 | Lwn 443 | Lwn 490 | Lwn 510 | Lwn 555 | Lwn 670 | |
|---|---|---|---|---|---|---|---|
| Global | |||||||
| R2007 | 1.202 (38.25%) | 0.895 (24.51%) | 0.906 (19.98%) | 0.901 (16.58%) | 0.915 (15.24%) | 0.911 (17.60%) | 1.015 (42.30%) |
| R2009 | 0.980 (36.67%) | 0.953 (21.2%) | 0.964 (18.23%) | 0.936 (15.09%) | 0.940 (16.09%) | 0.957 (17.07%) | 1.032 (34.83%) |
 |  |  |  |  |  |  | |
| Coastal (< 200 m) | |||||||
| R2007 | 1.322 (42.03%) | 0.824 (33.92%) | 0.902 (22.43%) | 0.908 (19.79%) | 0.936 (15.61%) | 0.918 (17.16%) | 0.865 (33.93%) |
| R2009 | 0.994 (38.42%) | 0.957 (28.07%) | 1.001 (22.03%) | 0.963 (16.28%) | 0.979 (15.30%) | 0.976 (16.53%) | 0.981 (34.67%) |
 |  |  |  |  |  |  | |
| Offshore (200 - 1000 m) | |||||||
| R2007 | 1.122 (36.39%) | 0.603 (39.96%) | 0.793 (23.32%) | 0.838 (17.37%) | 0.854 (17.14%) | 0.824 (21.11%) | 0.706 (48.89%) |
| R2009 | 0.902 (40.22%) | 0.805 (27.39%) | 0.898 (19.35%) | 0.881 (15.48%) | 0.843 (18.12%) | 0.840 (22.57%) | 0.970 (44.02%) |
 |  |  |  |  |  |  | |
| Deep Water (> 1000 m) | |||||||
| R2007 | 1.012 (30.54%) | 1.020 (12.57%) | 0.947 (16.62%) | 0.922 (13.62%) | 0.956 (13.80%) | 0.955 (16.46%) | 1.683 (79.88%) |
| R2009 | 0.980 (31.58%) | 0.995 (13.40%) | 0.947 (14.85%) | 0.935 (13.64%) | 0.940 (14.91%) | 0.999 (15.77%) | 1.186 (35.44%) |
 |  |  |  |  |  |  | |
To assess overall improvement in coastal retrievals, a detailed regional time-series analysis in Chesapeake Bay was performed. Comparison with the previous reprocessing shows a dramatic improvement in chlorophyll retrievals relative to in situ measurements, primarily due to the updated updated correction for non-zero water-leaving radiances in the NIR. The analysis also shows significant improvement in aerosol Angstrom retrievals relative to AERONET measurements, due to the new aerosol models and updated vicarious calibration. The number of negative water-leaving radiance retreivals was substantially reduced, due to a combination of the NIR algorithm update, additional NO2 corrections, and the new aerosol models.
The table below shows the relative change in mission mean retrievals in global deep water for SeaWiFS Reprocessing 5.2 (R2007) and this Reprocessing (R2009.1).
Deep-Water |
|||||||
| sr2007 | sr2009.1 | sr2009.1/sr2007 | |||||
| Prod | Mean | Std Dev | Mean | Std Dev | Mean | Std Dev | |
| chlor_a | 0.18510 | 0.01540 | 0.17632 | 0.01447 | 0.95315 | 0.03106 | |
| Rrs_412 | 0.01028 | 0.00038 | 0.00984 | 0.00037 | 0.95778 | 0.01630 | |
| Rrs_443 | 0.00811 | 0.00024 | 0.00795 | 0.00022 | 0.98092 | 0.01224 | |
| Rrs_490 | 0.00580 | 0.00011 | 0.00563 | 0.00010 | 0.97150 | 0.00784 | |
| Rrs_510 | 0.00352 | 0.00007 | 0.00341 | 0.00007 | 0.96657 | 0.00974 | |
| Rrs_555 | 0.00177 | 0.00005 | 0.00169 | 0.00005 | 0.95401 | 0.01537 | |
| Rrs_670 | 0.00029 | 0.00001 | 0.00023 | 0.00002 | 0.79464 | 0.04399 | |
| tau_865,aot_865 | 0.11313 | 0.00516 | 0.07348 | 0.00368 | 0.64947 | 0.01186 | |
| angstrom_510,angstrom | 0.35428 | 0.07055 | 0.69798 | 0.07925 | 2.00500 | 0.21047 | |
For other regions and water-class subsets, see the complete set of tabulated statistics for SeaWiFS. While mission mean changes are generally less than 5% in water-leaving reflectances and chlorophyll, more significant changes can be seen over the mission life-span. The figures below show the comparion and ratio in global deep-water chlorophyll retrievals as a function of time for the two reprocessings.
 |
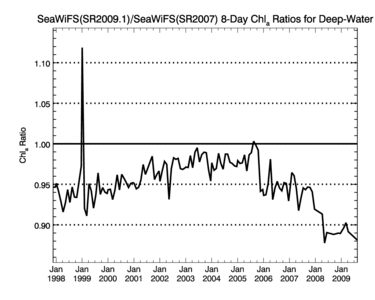 |
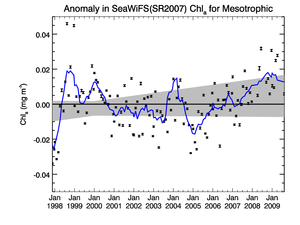
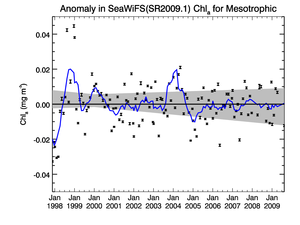
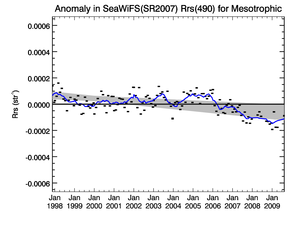
The larger changes toward the beginning and end of the mission are due to modifications of the SeaWiFS instrument calibration to improve agreement with on-board calibration sources. This is further illustrated in the figures below, where the temporal anomaly trend in mean chlorophyll and 490-nm remote sensing reflectance for global mesotrophic waters is plotted for each reprocessing. These plots are derived by subtracting the mean seasonal cycle from the total trend.
 |
 |
 |
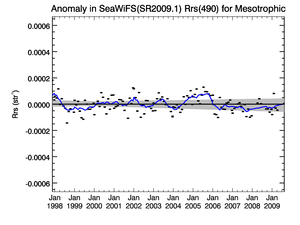 |
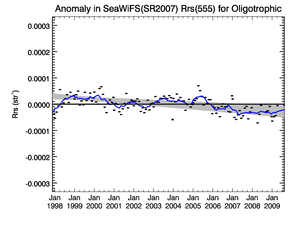
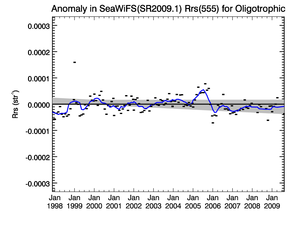
The chlorophyll anomalies from the R2007 processing showed a rapid rise toward the end of the mission, which is also evident in the 490-nm reflectances. This effect is believed to be an instrument calibration artifact, which was removed in R2009 after revision of the lunar calibration and instrument temperature and commanded-gain recharacterization. Corroborating evidence can be seen in the trends of 555-nm reflectance in oligotrophic waters, as shown below. It is reasonable to expect that trends in Rrs(555) would be flat in clear water, and indeed the R2009 results show the trend to be consistent with zero slope (grey box).
 |
 |
Some of the largest changes we see are in the derived aerosol properties. Due the the new aerosol models and the revised NIR vicarious calibration, both of which are now derived from AERONET observations, the mean Angstrom exponents have effectively doubled between R2007 and R2009. Specifically, the regional Level-3 statistics show mean Angstrom in the South Pacific Gyre and near Hawaii to be 0.5 and 0.65, which is more consistent with AERONET observations at Tahiti and Lanai, respectively (e.g., 0.75 reported by Smirnov et al. 2002). SeaWiFS aerosol optical thickness (AOT) retrievals have generally decreased relative to R2007. The mean Level-3 AOTs at the SPG and Hawaii are also now in better agreement with AERONET.
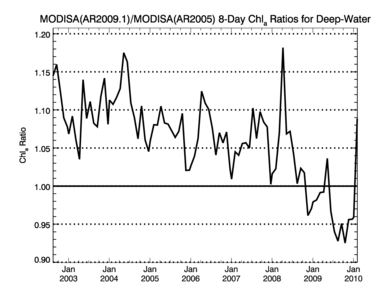
The table below shows the relative change in mission mean retrievals in global deep water for SeaWiFSMODIS-Aqua Reprocessing 1.1 (R2005) and this Reprocessing (R2009.1).
Deep-Water |
||||||
| ar2005 | ar2009.1 | ar2009.1/ar2005 | ||||
| Prod | Mean | Std Dev | Mean | Std Dev | Mean | Std Dev |
| chlor_a | 0.16318 | 0.01317 | 0.17257 | 0.01408 | 1.05908 | 0.05682 |
| Rrs_412 | 0.00989 | 0.00065 | 0.01016 | 0.00043 | 1.03236 | 0.08982 |
| Rrs_443 | 0.00795 | 0.00024 | 0.00811 | 0.00025 | 1.02125 | 0.03381 |
| Rrs_488 | 0.00588 | 0.00013 | 0.00583 | 0.00013 | 0.99175 | 0.01071 |
| Rrs_531 | 0.00246 | 0.00008 | 0.00247 | 0.00006 | 1.00454 | 0.01787 |
| Rrs_551,Rrs_547 | 0.00173 | 0.00007 | 0.00186 | 0.00006 | 1.07491 | 0.02146 |
| Rrs_667 | 0.00016 | 0.00001 | 0.00018 | 0.00001 | 1.15512 | 0.06860 |
| tau_869,aot_869 | 0.11558 | 0.00554 | 0.08540 | 0.00413 | 0.73897 | 0.01208 |
| angstrom_531,angstrom | 0.27633 | 0.04186 | 0.81674 | 0.06194 | 2.99618 | 0.31306 |
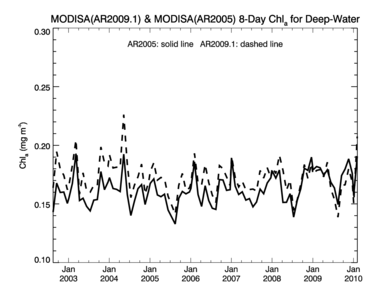
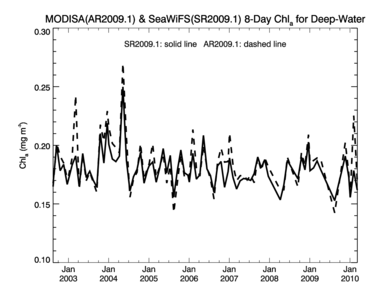
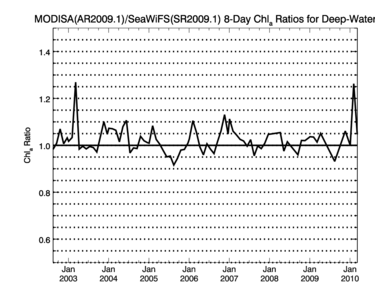
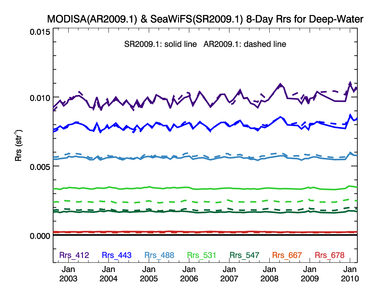
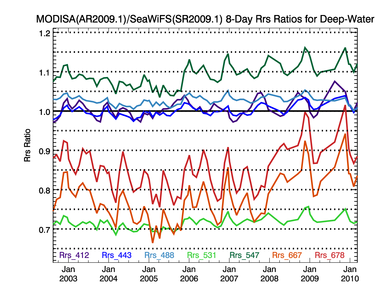
For other regions and water-class subsets, see the complete set of tabulated statistics for MODIS_Aqua. While mission mean changes are generally less than 5% in water-leaving reflectances and chlorophyll, more significant changes can be seen over the mission life-span. The figures below show the comparion and ratio in global deep-water chlorophyll retrievals as a function of time for the two reprocessings.
 |
 |
 |
 |
 |
 |
The complete time-series comparative analysis between MODIS-Aqua and SeaWiFS, before and after reprocessing, is available at the following links:
Franz, B.A. (2005). Methods for Assessing the Quality and Consistency of Ocean Color Products
Werdell, P.J., Franz, B.A., Bailey, S.W., Harding, L.W.Jr., and Feldman, G.C. (2007).
Approach for the long-term spatial and temporal evaluation of ocean color satellite data products in a coastal environment,
Proc. SPIE Earth Observing Systems XII, San Diego, CA., August 2007.
Bailey, S.W. and P.J. Werdell (2006).
A multi-sensor approach for the on-orbit validation of ocean color satellite
data products, Rem. Sens. Environ. 102, 12-23.
