In previous versions of the CZCS data, the sensor zenith and azimuth angles were derived using a general assumption about the satellite height and the attitude angles combined with the surface latitudes and longitudes. The assumptions would cause the sensor angles to be off from the correct values, resulting in incorrect computations of the Rayleigh and aerosol effects. Nimbus 7 orbit position and velovity data, available with SMMR data, allowed the computation of the satellite position, which when combined with the observation positions on the earth, result in improved sensor view angles. The following is a characterization of the changes in the sensor view angles that resulted from the change.
The new sensor azimuth and zenith is compared to the old values for 1 line of data (line 8000) from the file C1978337171133.L2_MLAC. The old values are plotted as the thin solid line while the new values are plotted as the thick line. Along the line, at pixel values 492, 984, and 1476 are plotted letters: O for the old values and N for the new values, to show the old and new azimuth and zenith. Note the discontinuity in the zenith angle that occured with the old sensor calculation near the lowest zenith angle.
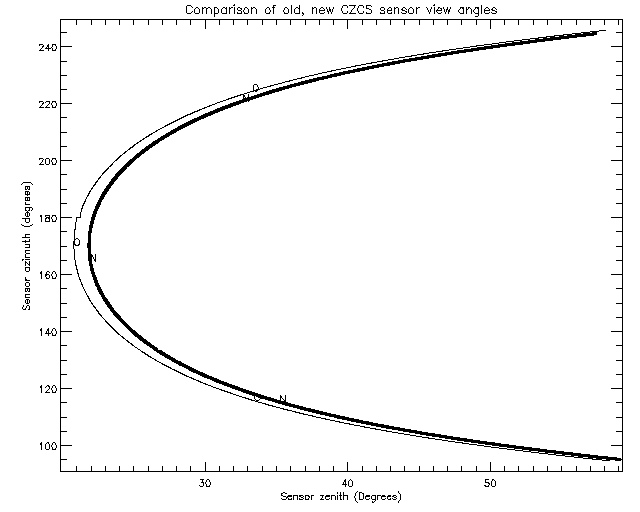
In general, the zenith angle difference ( new - old) ranged from -2.5 to 2.5 degrees and the azimuth difference ranged from -7 to 12 degrees.
The mean of the sensor view angle change (the angle the sensor view angle is rotated through in going to the new navigation) is shown on the plot below at various times through the CZCS mission. All mean differences were computed using granules taken at about 30 degrees North so as not to include any latitudinal effects. Sample granules were taken ecery 20 days from the start of the mission to 1980, after which samples were taken every 90 days.

An annual cyclical trend is seen in the mean difference with the minimum difference in the winter and the maximum in summer. Some increase in the mean difference is seen toward the end of the mission, but the mean difference ranges from 1.5 deg to 3 deg.
The change in sensor view vector is plotted as a function of latitude for all points in data granules selected near day 337 of 1978 to show any latitudinal dependence of the sensor vector change.

The same plot is made below only with points having a sensor zenith angle less than 30 degrees. It tends to remove some of the high and low excursions.

The maximum sensor vector change is at around -20 degrees and diminishes towards the equator.
Combined with the annual trend, this suggests that the sensor vector difference is the greatest at the solar sub point and migrates north and south througout the year.
In the next 2 plots, selected points from a southern and a northern latitude granule (having -20 and + 20 degree tilt) are plotted at theit latitudes and longitudes. The vectors from each point represent the change in sensor zenith angle as the Y component of the vector and the change in sensor azimuth as the Y component of the vector. The magnitude of the changes is reduced by a factor of 5 to make the vectors appear conveniently on the plot.

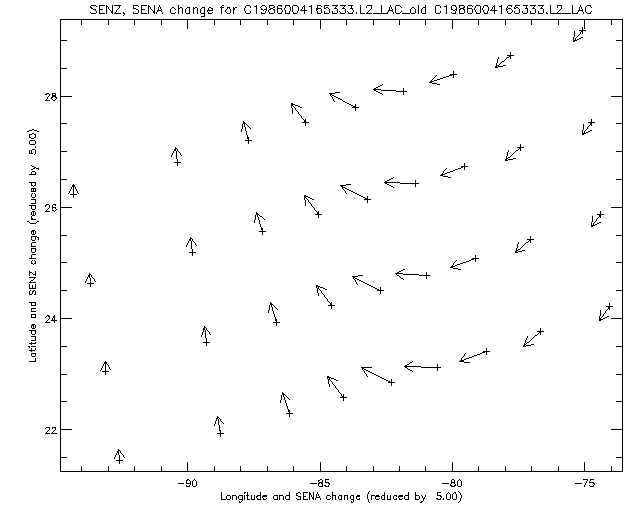
The variations could cause systematic changes in the data as a function of latitude and of sensor zenith angle (or pixel across scan).
Changes in the derived Lwn, chlor_a and tau at 670 are examined below
The following images show the chlorophyll-a images for granules at about 40 - 50 degrees South around Southern Argentina.
BEFORE SENSOR ANGLE CHANGE

AFTER SENSOR ANGLE CHANGE

CHANGE IN CHLOR_A

This is one of the larger changes found. The higher chlorophyll portions change from 2 mg m^3 to 1 mg m^3. Most other regions have much smaller chlorophyll changes as will be seen below.
Similar mission-long plots can be made for the CZCS Lwn, chlor_a and tau. The plots below in the left column are the mean of the parameter difference for granules through the mission and the error bars are the SD. In the right Column, the mean % change in each parameter and its SD are plotted. Data was eliminated if the following flags are on:
ATMFAIL,LAND,CLDICE,HILT,HISATZEN,STRAYLIGHT,COCCOLITH,TURBIDW,HISOLZEN,LOWLW,CHLFAIL,NAVWARN,ABSAER,MAXAERITER,ATMWARN

An annual trend appears somewhat in the Lwn plots, but is not as clear as in the sensor angle change. All bands behave in the same way, with decreases in Lwn at their greatest in the fall. On average, the Lwn decreased by 0.025 to 0.05 or about 5%. Note that this is in the 30 degrees N latitude.
No trend is easily visible in the chlor_a and tau_670 plots, although the imagery has shown chlorophyll changes at 50 degrees south.
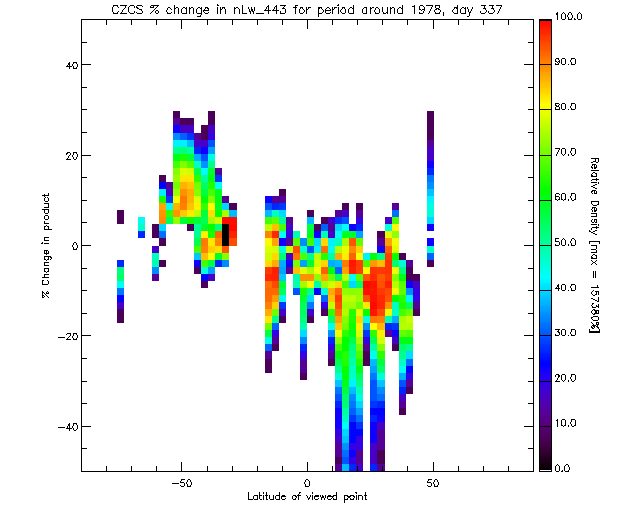
Density plots of the difference and % difference in Lwn chlor_a and tau vs latitude are shown below.
| Parm Name | Change | % Change |
|---|---|---|
| nLw_443 |

|
|
| nLw_520 |

|

|
| nLw_550 |

|

|
| chlor_a |

|

|
| tau_670 |

|

|
The Lwn increases south of about 30 south and decreases to the north. In both chlor_a and tau, there is no consistent latitudinal trend. However, the chlor_a has more decreases in value in the south and more increases in the north. These changes probably occur in the higher chlorophyll pixels, where the Lwn_443 is already low and linear changes in its value influence the chlorophyll value more than a similar change at 550 would.
