CZCS Evaluation
CZCS Quality Assessment
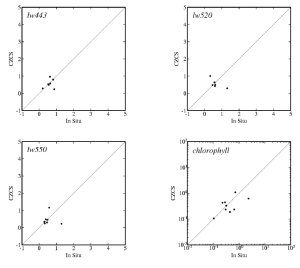
The availability of relevant in situ radiometry collected during the CZCS mission is extremely limited. NIMBUS Experiment Team (NET) conducted a series of field compaigns as described inAcker et al. (1994). This data was processed for match-ups with CZCS retrievals using modern protocols described in Bailey & Werdell (2005). Only 6 measurements passed all quality screening. The results are plotted below.
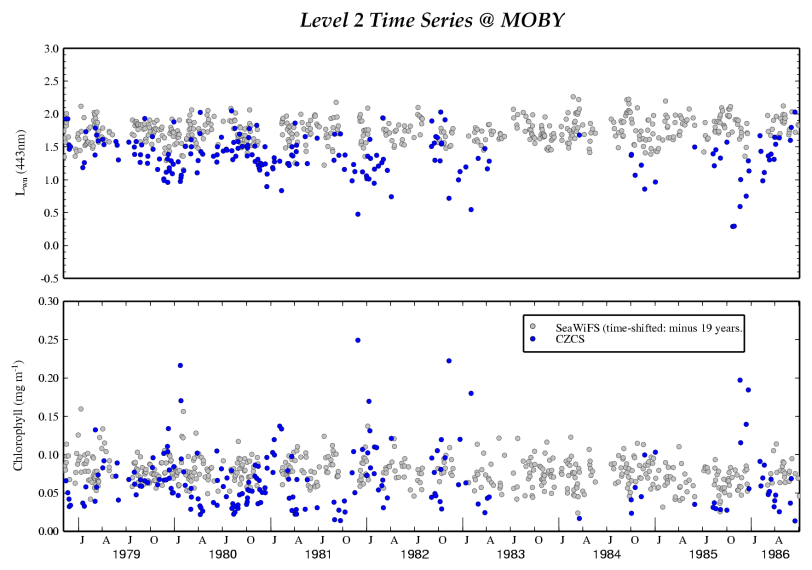
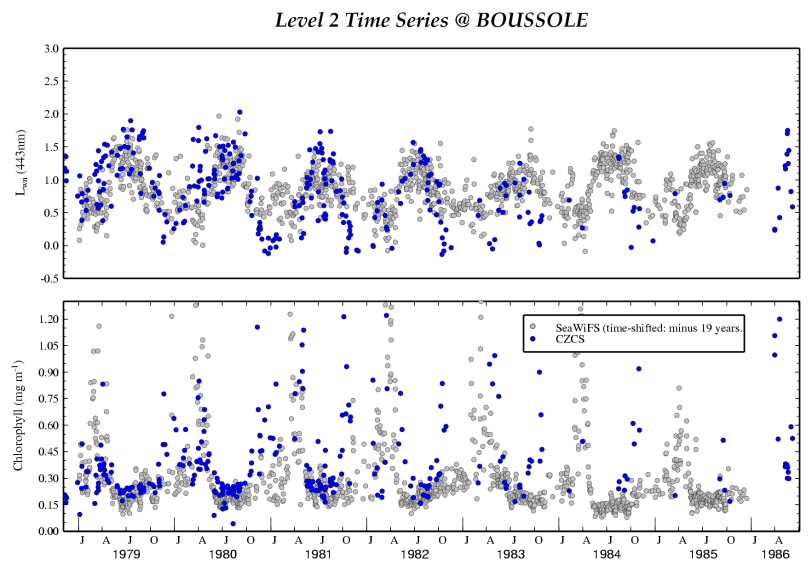
Comparisons between CZCS and SeaWiFS are useful only to assess whether the CZCS processing retrieves a similar range of water-leaving radiances and chlorophyll concentrations. The plots below show temporal trends in nLw(443) and chlorophyll retrievals for three regions that have relatively good temporal coverage during the CZCS mission. The SeaWiFS trends have been shifted back in time by 19 years to overlay the CZCS mission.
| North Pacific (MOBY) | South Pacific (E. Australia) | Mediteranean (Boussole) |
 |  |  |
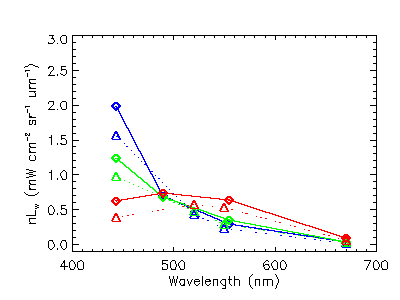
An effort was also made to evaluate CZCS relative to SeaWiFS on a global scale. In this analysis, the SeaWiFS data from the year 2000 was compared to each year of the CZCS mission. Mean values for each date were derived by averaging bins from the 8-day, 9-km binned products of each sensor. The data was further stratifiesd into regional subsets correcponding to waters that are typically oligotrophic, mesotrophic, and eutrophic. Only those bins observed by both sensors were included in the averages. Apparent variability in SeaWiFS from year to year is therefore due only to the variation in spatial sampling of each subset over the CZCS mission. The year 2000 was chosen for SeaWiFS as a typical year (uneffected by major geophysical events like el nino).The
comparative temporal trends are posted here.The plot below summarizes the results over the full CZCS mission, where mean oligotrophic (blue), mesotrophic (green), and eutrophic (red) water-leaving radiance is plotted with wavelength (solid lines for SeaWiFS, dashed lines for CZCS).
 Mean Chlorophyll over CZCS Mission, Compared to SeaWiFS
| | SeaWiFS | CZCS | CZCS/SeaWiFS |
| subset | mean | stdev | mean | stdev | mean | stdev |
| oligotrophic | 0.072 | 0.009 | 0.066 | 0.021 | 0.924 | 0.260 |
| mesotrophic | 0.271 | 0.056 | 0.371 | 0.119 | 1.407 | 0.49 |
| eutrophic | 2.189 | 0.446 | 2.653 | 0.923 | 1.229 | 0.408 |
Discussion
References
Acker, J.G.(1994).
The Heritage of SeaWiFS: A Retrospective on the CZCS NIMBUS Experiment Team (NET) Program. NASA Tech. Memo. 104566, Vol. 21, S.B. Hooker and E.R. Firestone, Eds., NASA Goddard Space Flight Center, Greenbelt, Maryland, 44 pp.