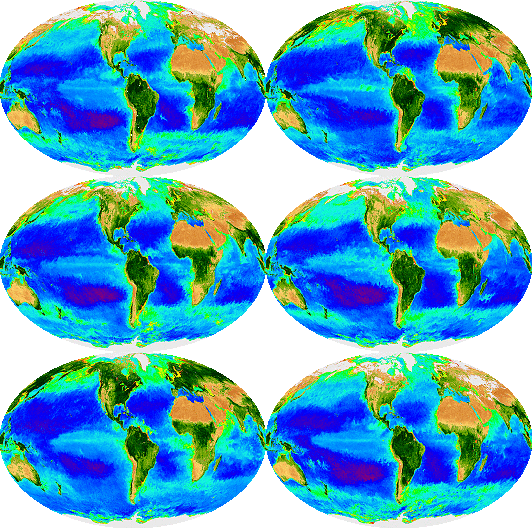
The SeaWiFS instrument aboard the OrbView-2 spacecraft has been collecting global ocean color (and land color) measurements for the past eight years. The data collected during that time are revolutionizing our understanding of how our home planet lives and breathes. These animations provide a glimpse of the complex responses of chlorophyll-bearing, photosynthesizing organisms to changes in insolation, temperature, nutrient availability, rainfall, and other environmental factors.
If you have a broadband connection to the internet, plenty of available memory, and a bit of patience, you can view the entire animation centered either on the Americas or on eastern Asia and Australia. Each of those animations is around 90 megabytes large. Selected extracts from the animation are shown below.
-
El Niño/La Niña transition (1997/1998)

-
Bloom north of Hawaii (2000/2001)

-
Bloom east of Madagascar (1998/1999)

An animation of ocean chlorophyll concentrations in the western North Atlantic Ocean as measured by Aqua-MODIS is also available.
If you have Google Earth on your computer, you can now download a KML file that references a ten-year animation of the SeaWiFS biosphere. Just click on the icon above.